 |
 Chapter 2
CONTROL SYSTEMS AND HOMEOSTASIS
The title of this book is The Nervous System in Action. It
is about action--things happening in the nervous system. It is
appropriate to ask why things happen.
Sometimes we act in response to a
specific stimulus. When an object approaches the cornea of the eye, the
lid closes to protect the cornea from damage. When the tendon of a
muscle is tapped, the muscle contracts. In these cases it is easy to
identify the stimulus and the response. Other times it is not easy to
identify what caused a particular action. Sometimes the actions are
part of some continuous activity. The body regulates its temperature
continuously. It may increase or decrease its temperature when it finds
that it is too cold or too hot. In this case, temperature is being
regulated by a control system, and the control is called
homeostasis.
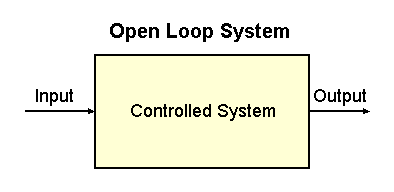 |
Fig. 2-1. An open loop system. The controlled system is
indicated by the rectangle. Also indicated are the input to the system
and its output.
|
Engineers refer to the first kind of action, a simple response to a
stimulus, as an open loop system. It is useful to draw
a diagram of how such a system works. Such a diagram is shown in Fig.
2-1. The system being controlled is contained within the box marked
"controlled system." That might be the system that controls the eyelid,
for example. There is an input to the system--the approaching object--and
an output from the system--the closing of the lid. The system simply
responds to the input.
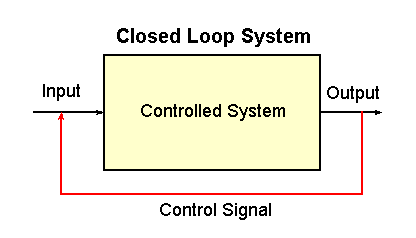 |
Fig. 2-2. A closed loop control system. The controlled
system is indicated by the rectangle. Also indicated are the input,
output and control signal.
|
On the other hand, the system that controls body temperature is called a
closed loop system. The diagram for such a system is
shown in Fig. 2-2. There are also a controlled system, input and output
in this kind of system, but, in addition, there is something that senses
the output of the system and effects some change in the input. It is
this connection that makes this a "closed loop" system.
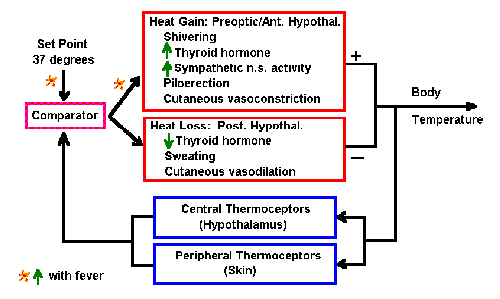 |
Fig. 2-3. Block diagram of the system for control of body
temperature.
|
A diagram of the system that controls body temperature is shown in
Fig. 2-3. Somewhere in the brain, perhaps the hypothalamus, the optimum
temperature of the body (set point) is stored. That
information is continuously
available to some structure, we call the comparator. The comparator
sends signals to
- heat gain mechanisms in the preoptic area or anterior hypothalamus
leading to
- shivering
- increased thyroid hormone output
- increased activity in the sympathetic nervous system
- piloerection
- cutaneous vasoconstriction
- heat loss mechanisms in the posterior hypothalamus leading to
- decreased thyroid hormone output
- sweating
- cutaneous vasodilation
The output of these mechanisms will end as either a net increase or a
net decrease in body temperature. The body temperature is sensed by
thermal receptors (thermoceptors) in the brain and peripherally in the
body, and the value is sent to the comparator where it is compared with
the set point. If the value is less than the set point, then signals go
mainly to the heat gain mechanisms; if it is greater than the set point,
then they go mainly to the heat loss mechanisms. In this way, body
temperature is constantly sensed and maintained constant (i.e.,
homeostasis).
In a feedback control system, the output is sensed
and this information is used at an earlier point in the system--it feeds
back. Actually, Fig. 2-4 illustrates feedback control.
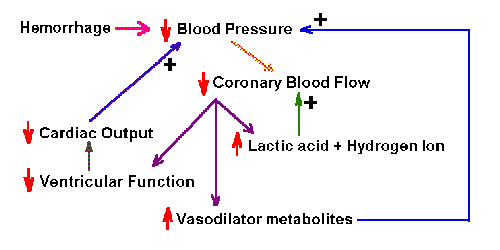 |
Fig. 2-4. Schematic diagram of the positive feedback system
that is activated by hemorrhage. Like most positive feedback systems,
this one is unstable, and if unchecked, will result in death.
|
Positive feedback systems In a positive feedback
system, the feedback is used to increase the size of the input.
By nature, such systems are unstable, and they are most often associated
with pathological conditions. An example of a positive feedback system
is shown in Fig. 2-4. In this diagram, hemorrhage leads to a decrease in
blood pressure, which, it turn, leads to a decrease in flow in coronary
arteries. The consequences of the decreased flow are
- increased lactic acid and hydrogen ion accumulation, which lead to further decrease in
coronary blood flow
- increased vasodilator metabolites, which lead to further decreased
blood pressure
- decreased contraction of the ventricles of the heart, which leads to
decreased cardiac output and further decreased blood pressure
Clearly, none of these consequences is good. Several passages through
this system will lead to excessive decrease in blood pressure and death.
This is a positive feedback system because all of the consequences tend
to increase the effect of the hemorrhage in lowering blood pressure.
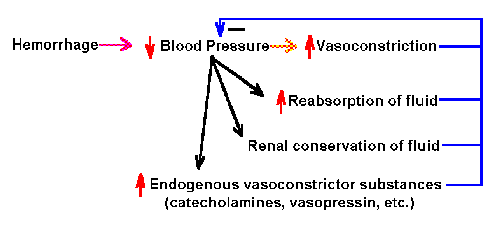 |
Fig. 2-5. Schematic diagram of the negative feedback system
that is activated by hemorrhage.
|
Negative feedback system In a negative feedback
system, the feedback is used to decrease the size of the input.
These systems are usually stable, and they are associated with beneficial
regulation of physiological parameters. An example of a negative
feedback system is shown in Fig. 2-5. In this diagram, hemorrhage leads
to decreased blood pressure, which in turn leads to
- increased reabsorption of fluid
- increased constriction of blood vessels
- increased renal conservation of fluid
- increased endogenous vasocontrictor substances, such as
catecholamines and vasopressin
All of these lead to increased blood pressure. This consequence counters
the effect of the initial hemorrhage and is, therefore, beneficial. This
is a negative feedback system because all of the consequences tend to
decrease the effect of the hemorrhage in lowering blood pressure.
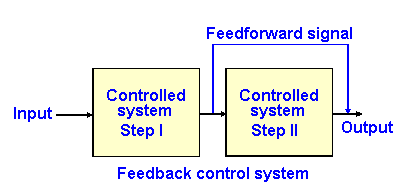 |
Fig. 2-6. Block diagram of a feedforward control system.
|
In a feedforward system, the output of one stage of the processing of the control system is sent to a later stage of the process to affect later activity. The diagram for such a process is shown in Fig. 2-6. An example of a feedforward system is the preadaptation for exercise, changing the activity of postural muscles and of the vascular system in order to ready the body for the movement when it occurs. Moving the arm laterally shifts the center-of-gravity laterally, and the person would be in danger of falling over were not compensations made in the postural musculature to prepare for the movement.
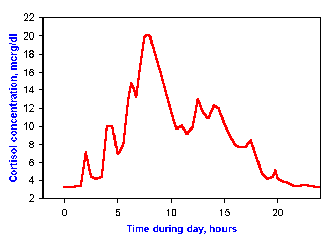 |
Fig. 2-7. Example of a diurnal rhythm. Cortisol
concentrations in blood are controlled by a system that functions on a
24-hour cycle.
|
The time-frame over which a parameter is controlled can be quite
variable, ranging from seconds to years. Here are some examples of
different ones.
Diurnal rhythms Many parameters are regulated over a period
approximating one day or 24 hours. They often are timed or "synched" by
sleep-wakefulness or light-dark cycles. For example, the hormone
cortisol, which is made by the adrenal gland and has important functions
in metabolism of proteins, carbohydrates and fats, is controlled on a
24-hour cycle. Maximum concentration in blood are achieved between 7 and
8 am each day, with a nadir about midnight. This pattern can be seen in
Fig. 2-7.
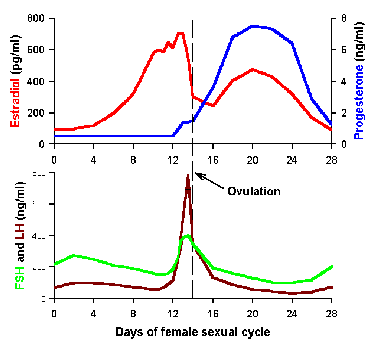 |
Fig. 2-8. Example of a lunar rhythm. Control of the
ovulatory cycle in the human female occurs over an approximately 30-day
period.
|
Lunar rhythms Some parameters are regulated over a period
approximating one month or 30 days. Some appear to be tied to phases of
the moon, but for others the synchronizing event is unclear. The
ovulatory cycle in the human female is an example of such a lunar
rhythm. This is a complicated mechanism (4 of the hormonal participants
are shown in Fig. 2-8), but it suffices for our
purposes now to say that ovulation occurs in the middle of the cycle and
is triggered by increases in luteinizing hormone (LH). This can be seen
in the center of the lower graph of Fig. 2-8. The events depicted in
the diagram are replayed every month during the reproductive span of the
human female.
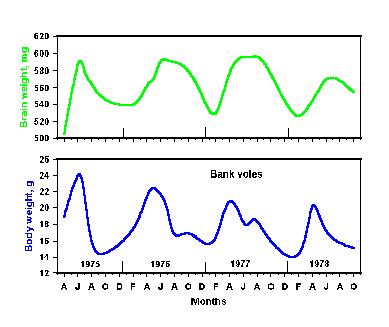 |
Fig. 2-9. Brain (upper) and body (lower) weights in the bank vole are
controlled with a period of about 1 year.
|
Seasonal rhythms Many events are regulated with a period
approximating one year. These could be synchronized by changes in
temperature, sunlight or tides, and often the triggering stimulus has
not been identified with certainty. An example of such a seasonal rhythm
is shown in Fig. 2-9. Here the brain weights (upper graph) and body
weights (lower graph) have been measured on a monthly basis over a
period of 4 years. Clearly, both parameters are at a maximum in March
through May and at minimums in January through February. These
measurements were made in bank voles, which have definite annual
breeding cycles. Perhaps they would not occur in humans, which lack
such cycles, but undoubtedly some other parameters would have seasonal
rhythms in humans.
Developmental rhythms Some events are controlled on a life-
time basis. For example, puberty occurs only once per individual. The
same may be true for peak intellectual and physical performance. No one
knows what triggers these events or why they occur when they do.
| Continuous versus pulsatile control |
In the nervous system, action potentials last between 0.25 and 1.0
msec. Slower nervous events last between 4 and 5 msec, sometimes
longer. Synaptic transmission takes between 2.0 and 500 msec. None of
these times approaches the scale of diurnal, lunar or seasonal rhythms.
Obviously, if the nervous system were to control such rhythms, it would
have to act repeatedly--just one action potential is unlikely to do the
job.
Table 2-1
Hormone | Half-life |
| Thyroxine | 6 days |
| Cortisol | 0.07 days |
| Testosterone | 0.04 days |
| Aldosterone | 0.016 days |
| Growth hormone | 0.017 days |
| Insulin | 0.006 days |
The situation is slightly better for the endocrine system. The half-
lives of a number of hormones are shown in Table 2-1. With the exception of
thyroxine, none of these hormones has a half-life longer than a day. The
release of luteinzing hormone (LH) is known to be pulsatile, each pulse
lasting about 30 minutes.
Some actions that must be controlled by the body are very brief,
e.g., many movements. Some appear to be very long, e.g., growth. How
can we get what appears to be continuous control with what must be a
pulstile controller? Let's take an example. Muscle contractions can
last for part of a second, a minute or longer, but the controller, the
action potential in the motoneuron does not last more than 2 msec. The
answer lies in the time-constant, i.e., the duration of action, of the
controlled system. In our example, the controlled system is the muscle.
Muscle contraction is a mechanical event, which is triggered by the
action potential, an electrical event. The mechanical event is very
slow (requires 250 or more msec for a single response) compared to the
electrical event. The effect of two action potentials lasts even
longer. If several action potentials follow each other closely in time
down the axon, then the contraction of the muscle will be continuous and
maximal for that muscle. In this way, a pulsatile controller can
produce seemingly continuous control.
[TOC] [Chapter 3] [Glossary] [Index] [Abbreviations]
|

 Chapter 2


