 Chapter 8
AUDITION
An object vibrating in air sets up motion of the molecules in the air around it so that when the object moves in the direction of an observer, it compresses the air and when it moves away, it produces a rarefaction. This sequence of compressions and rarefactions is transmitted in a straight line through the air at a characteristic speed. Sound waves, unlike light, cannot travel through a vacuum, but require some medium, gaseous, liquid or solid, each medium with a different speed of conduction. The ear is a structure specialized to receive these vibrations of the air, transduce them into nervous impulses, encoding important features, and transmit the impulses to the central nervous system; the result is what we call hearing.
Highly sensitive mechanoreceptors in the ear are capable of sensing amplitudes of vibrations of the air as small as 10-8 centimeters (the diameter of a hydrogen ion is 2 x 10⁻⁸ cm), yet the ear is structured in such a way that it can withstand sound so intense that it vibrates the whole body (this may come at some cost as we shall see). It transduces sounds of frequencies from 20 Hertz (Hz = cycles/sec) to 20,000 Hz into nervous impulses, allowing the human to distinguish small changes in frequency as changes in pitch-the higher the frequency, the higher the pitch. At the same time, a change in size or amplitude of the vibration is perceived as a change in loudness. Perceived loudness is actually a function of both frequency and amplitude because the sensitivity of the ear varies with frequency, being less sensitive at very low and very high frequencies and most sensitive to sounds in the range of frequencies used by human spoken language, i.e., in the range from 40 Hz to 3 kHz.
 |
Fig. 8-1. Auditory sensitivity in man. The upper curve shows the threshold of pain for different frequencies ("feeling"). Labeled "lab" is the clinical threshold of hearing curve for a normal human; the "office" threshold of hearing curve presented to show the effect of room noise on auditory threshold. (Licklider JCR: Basic correlates of the auditory stimulus. In Stevens SS [ed]: Handbook of Experimental Psychology. New York, Wiley, 1951) |
The clinical procedure in which auditory sensitivity is tested over the normal range of human hearing is called audiometry, and the graphic representation of the sensitivity is an audiogram. Normally, clinical audiograms are not done with the precision required to test the absolute sensitivity of the hearing apparatus because it is too difficult to control extraneous noise. A normal clinical audiogram is shown in Figure 8-1, office. This should be compared with the audiogram obtained under ideal conditions (Fig. 8-1, lab). The human ear, in both types of audiogram, is most sensitive to sound of 1000 to 2000 Hz, and that sensitivity is reduced for frequencies both above and below this range. The measured thresholds are all higher on the clinical audiogram because it takes more sound intensity to reach the threshold of hearing when the stimulus tone is superimposed on a background of room noise.
The ordinate of Figure 8-1 is plotted in decibels (dB), a logarithmic scale, because the useful range of intensity from the minimum audible to the maximum tolerable loudness spans 1014-fold. Specifying intensities over such a range is unwieldy unless they are specified in terms of logarithmic units. The Bel system simply expresses a ratio of sound intensities in log units (common logarithms, base 10). Thus, 1 Bel indicates a 10-fold difference in intensity, 2 Bels a 100-fold difference, and so forth. More commonly the decibel is used; one Bel = 10 decibels. The decibel system compares two intensities or pressures, so in order to specify a single intensity in dB we must have a standard reference value. In audiology, the standard value is the threshold for a 1000 Hz tone, which is 2 x 10⁻⁵ Pascals (1 Newton/m2)in terms of pressure. In normal clinical measurement, this standard is used because of its ease of measurement, and it is designated SPL (sound pressure level). To get some idea of sound intensity in terms of decibels, consider the following: referenced to the threshold of hearing (0 dB), a whisper is about +15 dB, the average home noise level is about +25 dB, conversation is about +60 dB, and a jet engine makes noise at about +110 dB. Painful sound has an intensity greater than +130 dB.
 |
Fig. 8-2. How the threshold of hearing curve (A) is converted to a hearing-loss curve (B). Line a shows data from a normal subject; in the hearing-loss graph, this is converted to 0 dB. Line b shows data from a subject with high-frequency hearing loss; arrows show the magnitude of the hearing loss. (Towe AL: Audition and the auditory pathways. In Ruch TC, Patton HD [eds]: Physiology and Biophysics, 19th ed. Philadelphia, WB Saunders, 1965) |
Figure 8-2 illustrates how audiograms are used. In Figure 8-2A are plotted the threshold of hearing or audibility curve for a patient with a hearing loss (curve b) and a normal curve (curve a). Notice that the patient's threshold is higher for every frequency above 128 Hz. The normal audibility curve is usually converted to a straight line at 0 dB loss, and the patient's values are plotted as deviations from the normal values (curve Bb, in this case below the standard straight line, but they can also be above). The result is a hearing loss curve, as shown in Figure 8-2B. This particular patient has a high tone (frequency) hearing loss such that there is a 20 dB deficiency at 1024 Hz (left arrow in A and B) and a 40 dB deficiency at 4096 Hz (right arrow). The threshold of hearing for a 1024 Hz tone is elevated 100 times over normal, i.e., 100 times more sound pressure is required for this patient to hear a tone of this frequency than for a normal person. Similarly, the threshold is elevated 10,000 times normal at 4096 Hz. In Figure 8-2B, the patient's loss at 16,384 Hz is about 60 dB which is a 1,000,000-fold increase in threshold in terms of pressure.
 |
Fig. 8-3. The peripheral auditory apparatus with cochlea rotated slightly to show coils and auditory nerve. (Davis H, Silverman SR: Hearing and Deafness, 3rd ed. New York, Holt, Rinehart, Winston, 1970) |
The shape of the hearing loss curve is used as an indicator of the type of pathological condition from which a patient is suffering. Actually, the patient whose audiogram is shown in Figure 8-2 is quite normal, at least among people his age. Characteristically, advancing age is accompanied by decreased sensitivity to high tones, or presbycusis. This loss in sensitivity is the result of degeneration of the receptors in the basal turn of the cochlea. We shall see later that other types of hearing loss also have characteristic audiograms.
| Anatomy and mechanics of the ear |
The ear is normally considered to have three parts, an outer ear, a middle ear, and an inner ear, as illustrated in Figure 8-3. The outer ear consists of the auricle or pinna, the part seen on the outside; an elongated tube, the external auditory meatus; and the tympanic membrane. The primary function of the auricle is to capture sound and funnel it into the external meatus. Although the human auricle is undoubtedly a lot less efficient than that of many other animals, notably the dog's, there is still a considerable deficit if the auricle is lost. The shape of this structure may be of some help in localizing sounds in space, especially in distinguishing sounds coming from a source in front from those coming from behind the head.
The external auditory meatus certainly acts as a channel for sound to the tympanic membrane, but it also shelters the ear drum and provides a relatively constant environment in terms of temperature and humidity, thus preserving the elasticity of the drum. It also acts as a tubal resonator, amplifying sound pressures particularly in range of 2000 to 5500 Hz. The pressure amplification in this frequency range can be 5-10 dB. The tympanic membrane is a cone-shaped piece of elastic tissue whose apex points inward and is the point of attachment of one of the ossicles, the malleus. Normally, the tympanic membrane is kept under tension for better reception of vibrations of high frequency. This tension is somewhat variable and under control of the tensor tympani muscle that attaches to the malleus near its point of contact with the tympanic membrane, and to the medial wall of the middle ear dorsal to the opening of the Eustachian tube (Figure 8-4). This muscle is innervated by fibers of the fifth cranial nerve, and its contraction pulls the drum dorsally and medially, tensing it.
Also within the middle ear are three small bones, the malleus, incus, and stapes. These three bones are linked together by hinge-like joints and are joined to the tympanic membrane as already described and to the annular ligament of the oval window of the cochlea. Movements of the tympanic membrane set the ossicles in motion, the malleus and incus vibrating as a unit and imparting a piston-like motion to the stapes, which pushes against the annular ligament of the oval window.
The ossicular chain functions as an impedance-matching device, to compensate for the difference in impedance between air and the fluids of the inner ear. Acoustic impedance is the property of a material, roughly speaking, that relates the pressures produced to the amplitudes of vibrations when sound energy passes through a medium. If the impedances of two materials are very different, sound will not easily pass from one to the other. As a child, you may have tried an experiment while swimming without realizing the implications of the results. If two stones are tapped together in air and the ear is in air, the sound made is clearly audible. Sound conducts well through air. If two stones are tapped together underwater and the ear is underwater, the sound made is, again, clearly audible. Sound conducts well through water. On the other hand, if two stones are tapped together in air and the ear is underwater (or the other way round), the sound made is almost imperceptible. Sound does not conduct well from air to water or from water to air. This is because the impedances of water and air do not match, and most of the sound is reflected off the interface between the two media, remaining in the medium in which it was generated.
 |
Fig. 8-4. The middle ear and its contents. A. Note the connection of the tensor tympani muscle to the malleus and the attachment of the malleus to the tympanic membrane. B. A view of the middle ear with the eardrum, malleus, and incus removed. Note the attachment of the stapedius muscle to the stapes. (Davis H, Silverman SR: Hearing and Deafness, 3rd ed. New York, Holt, Rinehart, Winston, 1970) |
The impedance of the fluid in the cochlea is about 30 times greater than that of air, and if the sound were applied directly to the oval window, most of it (~97%) would be reflected, leaving only 3% transmission. It is necessary to somehow compensate for this difference, to match the characteristics of one material to that of the other. The ossicular chain converts the large displacement, low pressure signal in air to the small displacement, high pressure signal needed for transmission through the cochlear fluid. It does this by acting as a lever system and by exerting all the force at the tympanic membrane on a smaller surface.
The lever formed by the malleus and incus is illustrated in Figure 8-5. The pivot point or fulcrum is located farther from the tympanic membrane than from the stapes, and the ratio of the lengths of the lever arms is 1.3:1. This means that the displacement at the oval window is less than at the tympanic membrane by a factor of 1/1.3, but the force at the oval window is amplified by a factor of 1.3. The area of the tympanic membrane is 0.55 cm2, whereas that of the oval window is only 0.032 cm2. If the same force exerted on the tympanic membrane were exerted on the membrane covering the oval window, which is only 1/16 the area, then the force per unit area at the oval window would be 16 times that at the tympanic membrane. However, the lever arm itself exerts an amplification of 1.3, yielding a total pressure amplification of about 21-fold (about 13 dB). With this matching alone, 60% of the signal is transmitted, much improved over the 3% that would be obtained using direct coupling. Resonance and funneling in the external meatus increase sensitivity by another 3 dB. A further matching effect, almost to the point of 100% transmission, is provided by variations in the mode of vibration of the ear drum.
One other significant structure of the middle ear is the stapedius muscle. This muscle receives its innervation from a branch of the seventh cranial nerve, and it has its origin in the posterior wall of the middle ear and its insertion in the head of the stapes. Its contraction rocks the stapes out of the oval window (Fig. 8-4). The action of the stapedius, coupled with that of the tensor tympani, is to stiffen the ossicular chain and reduce transmission by as much as 40 dB, particularly at low frequencies. Reflex contraction is elicited by intense sound (>70 dB above threshold) to protect the delicate inner ear, but the latency of the contraction is so long (40-160 msec) that it can hardly offer much protection against brief, loud sounds. Military cannons frequently incorporate a clicker that activates these muscles in the operator's ears shortly (about 160 msec) before the large charge is detonated.
 |
Fig. 8-5. Schematic drawing of ossicle system to illustrate the lever arms and the position of the fulcrum. Relative areas of the tympanic membrane and the membrane of the oval window are shown. |
The oval window opens into the inner ear, a structure called the labyrinth, which is composed of the semicircular canals, the vestibule, and the cochlea. The first two structures are part of the vestibular system, and they seem to have no important function in audition. The bony labyrinth is filled with a fluid, called perilymph. In the perilymph is a membranous structure, the membranous labyrinth, filled with endolymph. The cochlea is a spiral structure, like a snail shell containing two and one half turns from its base at the oval window to its apex, whose corresponding membranous structure extends into the spiral as a blind tube. A vertical section of the cochlea, taken along the central pillar or modiolus, is shown in Figure 8-6A, and a close look at one turn is shown in Figure 8-6B. In A, arrows indicate the path of pressure waves originating in the oval window. A bony shelf, an extension of the modiolus, extends part way into the canal. Attached to this shelf and to the lateral wall by the spiral ligament is a delicate membrane, the basilar membrane, which supports the receptor elements of the ear. The basilar membrane, which is about 35 mm long in humans (average about 37 mm in males, about 32 mm in females), divides the canal approximately in half, and the upper half is further divided by Reissner's membrane. Between Reissner's and the basilar membrane (a part of the cochlea called the cochlear duct) is endolymph, outside is perilymph. The cochlear duct is sometimes called the scala media, whereas the portion of the canal above Reissner's membrane is known as the scala vestibuli, and the portion below the basilar membrane is the scala tympani. At the apex of the cochlea, the scala vestibuli and scala tympani communicate through a small opening, the helicotrema.
 |
Fig. 8-6. The cochlea and the organ of Corti. A. Diagram of the cochlea cut through along the modiolus to show the partition of the cavity by the basilar and Reissner's membranes. Arrows indicate the pathway of pressure waves originating in the oval window. B. Detail of the cochlear partition and the organ of Corti. (A. Curtis BA, Jacobson, S. Marcus EM: An Introduction to the Neurosciences. Philadelphia, Saunders, 1972. B. Davis H, Silverman SR: Hearing and Deafness, 3rd ed. New York, Holt, Rinehart, Winston, 1970) |
When the stapes moves inward at the oval window (Fig. 8-7), pressure waves are transmitted to the perilymph of the scala vestibuli and thence through Reissner's membrane and the basilar membrane to the scala tympani. In the scala tympani, the vibrations pass again through perilymph to the round window at the base of the cochlea. The membranous covering of the round window bulges into the middle ear cavity and forms the ultimate "give" in the system because the helicotrema is so small that little fluid moves through it. This means that the displacement in the cochlea caused by movement of the stapes is almost all across the basilar membrane.The "give" at the round window is necessary to prevent pressure-wave reflections within the cochlea.
On the basilar membrane sits the sensory organ of the ear, the organ of Corti, composed of a complex of supporting cells and sensory or hair cells. The hair cells are arranged in two groups, the inner and outer hair cells. Each hair cell (there are about 17,500) has up to 80 tiny hairs or stereocilia projecting out of it into the endolymph. The stereocilia grade in length from inside (toward the modiolus) to outside (toward the stria vascularis). Overlying the hair cells is a gelatinous structure, the tectorial membrane, into which the longest stereocilia project. When the basilar membrane moves up (A relative to B) and down (C relative to B), the tectorial membrane does not move quite with it because their centers of rotation are different, as shown in Figure 8-8, the result being that the stereocilia are subjected to a shearing force that deflects them. It is this movement of the stereocilia that gives rise to the receptor potential in the hair cell.
The tallest stereocilia of outer hair cells are imbedded in the tectorial membrane. The inner hair cells are deflected by tip-contact with Hensen's stripe (a protruding ridge on the under side of the tectorial membrane just medial to the stereocilia tips) when the basilar membrane moves upward. For both inner and outer hair cells, movement of the basilar membrane applies a shearing force to the tallest stereocilia, deflecting them. Electron microscopy shows that the stereocilia are connected together by tip links and side links that serve to interlock them. The result is that, when the tallest stereocilia are deflected, the shorter ones move with them.
 |
Fig. 8-7. Movement of pressure waves through the cochlea. |
Deflection of the stereocilia in a direction toward the tallest of them (the one located where the kinocilium would be if it did not degenerate after birth) excites auditory nerve fibers; whereas movement of the stereocilia in the opposite direction silences the fibers. An upward movement of the basilar membrane will deflect the stereocilia toward the outside (as shown in Fig. 8-8A), toward the taller stereocilia, and thus increase the generator potential (by 10-20 mV) in the hair cell. A downward movement of the basilar membrane will have the reverse effect (Fig. 8-8C). The changes in membrane potential of the receptors are caused by opening or closing of nonspecific channels in the membrane of the stereocilia. The resulting generator potential causes calcium influx through voltage-gated channels and release of a transmitter substance onto the attached neurons (much as happens at synapses as discussed in Chapter 13), which finally leads to the formation of action potentials in them.
 |
Fig. 8-8. Movements of the basilar membrane and the deflection of the stereocilia. The basilar membrane at rest is shown in B. A. Upward movement of the basilar membrane (arrow) deflects hairs away from the modiolus. C. Downward movement (arrow) deflects hairs toward the modiolus. (Klinke R: Physiology of hearing. In Schmidt RF [ed}: Fundamentals of Sensory Physiology. New York, Springer-Verlag, 1978) |
As shown in Figure 8-9, the base of each inner hair
cell receives the endings of 10-20 nerve cells which
reach the hair cell through the osseus spiral lamina (center of the spiral). The
modiolus houses the spiral ganglion, composed of
the somata of these primary afferent auditory
neurons. It is in these nerve endings that impulses
are initiated by the receptor potential, and it is the
axons of these cells that form the auditory nerve.
Most of the 35,000 axons in the auditory nerve
(about 95%) innervate inner hair cells, but about
5% innervate outer hair cells. There are three
rows of outer hair cells, but there is only one row
of inner hair cells. The difference in the innervation appears to lie in the fact that the innervation of outer hair cells by afferent fibers and efferent fibers in theosseus spiral lamina is about equal, but because of the frequent branching of the fibers, the number of efferent contacts with outer hair cells is greater than the number of afferent contacts. Inner hair cells appear receive contacts mostly from afferent fibers and to be the actual sensory receptors. Outer hair cells appear to be involved in an active process with actin and the tectorial membrane. Possible effects of this process are discussed later under Efferent control of cochlear sensitivity.
| Pitch perception |
 |
Fig. 8-9. Distribution of the afferent fibers to inner and outer hair cells. Direct afferent fibers innervate inner hair cells; outer spiral afferent fibers run between Deiter's cells before innervating outer hair cells. (Spoendlin H: The innervation of the cochlear receptor. In Moeller A {ed}: Basic Mechanisms in Hearing. New York, Academic Press, 1973) |
There are two theories to explain how pitch, or the frequency of vibration, is encoded by the auditory system. The first theory, the frequency theory, says that the pitch is encoded by the frequency of discharge in the primary auditory fiber. We know the basilar membrane moves up and down as the sign wave of a tone moves up and down. We also know that when the membrane moves up the hair cell is excited; when it moves down the cell turns off. So, for a sign wave, the cell may discharge once for each cycle. If the code consists of one action potential for each cycle of the stimulus, then the code would obviously be limited by the refractory period of the axon. An upper frequency limit of 1000 Hz, of course, falls short of the 20,000 Hz upper limit of pitch perception by the human ear. Actually, auditory nerve fibers can signal frequencies up to about 4,000 Hz in their discharge by discharging 1 spike/cycle up to their maximal discharge frequency and then, above that level, discharging 1 spike every two or three or five cycles, locked to a particular phase of sound vibration. Still their performance falls short of our pitch perception.
 |
Fig. 8-10. The cochlea uncoiled to show the thinning and widening of the basilar membrane at the apex. (Guyton A: Textbook of Medical Physiology. Philadelphia, WB Saunders, 1976) |
The other theory, the place theory, suggested by von Helmholtz, says that specific parts of the basilar membrane vibrate in response to different frequencies. This would make pitch perception a matter of which fibers were active (determined by where their hair cells were located along the length of the basilar membrane), rather than how much total activity they generated. If the cochlea were straightened out, it might look like the illustration in Figure 8-10. Notice that the basilar membrane is thicker, narrower, and stiffer at the base and thinner, wider, and more flexible at the apex. This suggested to von Helmholtz, by analogy to piano strings, that the base of the basilar membrane might vibrate in response to high frequencies, whereas the apex would vibrate in response to low frequencies. In its modern form, the place theory claims that, in response to vibration of the oval window, traveling waves are set up and move from base toward the apex in the basilar membrane, just like those set up in a string, one end of which is vibrated. Figure 8-11 shows a traveling wave, created by a 200-Hz tone, at two instants in time (A,B) along with the envelope of the displacements (C). The maximum excursion of the envelope occurs in this case at 28 mm from the stapes. As shown in Figure 8-12, the place where this maximum occurs varies with frequency, being nearer the stapes the higher the frequency of the vibration of the stapes(1). Systematic investigations by von Bekesy have shown that each frequency through the audible range has its place of maximal displacement on the basilar membrane, just as shown in the figure, but at low frequencies the entire basilar membrane moves up and down. Actually, because the base is stiffer than the rest of the membrane, traveling waves always begin at the base and progress toward the apex regardless of how they are initiated. This is true for waves induced by oval window movement, by bone-conducted vibration, or by pressure waves induced directly in the cochlear fluid (Wever EG, Lawrence M: Ann Otol Rhinol Laryngol 61:824-835, 1952).
 |
Fig. 8-11. Traveling wave in the basilar membrane. A,B. Surfaces represent the same wave at two instants in time. C. The envelope of the traveling wave indicating the maximum displacement at 28 mm from the stapes for a 200-Hz tone. |
It would appear that perhaps the frequency code is used for lower frequencies and the place code for higher frequencies, but both kinds of codes may be used for some frequencies. The traveling waves have actually been observed, but their existence could be deduced from the discharge pattern of fibers in the auditory nerve. Figure 8-13a is a plot of the threshold intensity curves or tuning curves for several auditory fibers. All tones of frequencies within the envelope of the curves increased the firing rate of the cell. The threshold for discharge of a cell varies with the frequency of the sound, but there is a single frequency for which each cell has the lowestthreshold. This frequency is called the best frequency for that cell. It is this sort of discharge pattern that one would expect to see if traveling waves, such as those in Figure 8-12, are set up in the basilar membrane; cells should respond over a range of frequencies with a best one, and the tuning curves of cells with low best frequencies should be broader than those with higher best frequencies because more of the basilar membrane moves for low frequencies.
 |
Fig. 8-12. Magnitudes of the upper half of the envelopes of traveling waves elicited in the basilar membrane by pressure oscillations of different frequencies. Note maxima for high frequencies near the base, low frequencies near the apex. (von Bekesy G, Rosenblith WA: The mechanical properties of the ear. In Stevens SS [ed]: Handbook of Experimental Psychology. New York, Wiley, 1951) |
The problem for the place theory is how to encode sound intensity. At first, it would appear that a simple frequency code would suffice, but pitch coding cannot be completely independent of discharge frequency, compromising a simple frequency code for intensity. This occurs because of the existence of traveling waves. For example, a tone of 250 Hz sets up a traveling wave in the basilar membrane with maximum excursion near the apex. At slightly greater intensity, the maximum excursion is greater, but still occurs at the same point. A point adjacent to the 250-Hz point, that corresponds to say the 300 Hz maximum point, is also caused to vibrate by the more intense 250-Hz tone at amplitude "x." Now the frequency of the tone is increased to 300 Hz. At some lesser intensity of the 300-Hz tone, the 300-Hz maximum point will also be moved by an amount "x." The problem for the place theory is to distinguish the louder 250-Hz tone from the softer 300-Hz tone. The rather wide tuning curves of auditory nerve fibers suggest that single neurons cannot in fact distinguish them, but we know the nervous system can and does. Perhaps some kind of ensemble code is used to encode intensity, as is likely if a frequency code is used for pitch.
| Central auditory pathways |
Primary auditory fibers enter the brain stem and immediately make connections with secondary neurons in the cochlear nucleus, as illustrated in Figure 8-14(2). From here, the auditory information goes to a remarkable number of places in the central nervous system. Fibers arising from the cochlear nuclei ascend in both a crossed and an uncrossed projection, which either enters the lateral lemniscus directly or first relays in the nucleus of the trapezoid body or the superior olive before joining the lateral lemniscus.
 |
Fig. 8-13. Tuning curves of auditory nerve fibers in a cat (A). All tones within the curves increased the firing of the cell, but the intensity required to increase the firing varied with frequency. The nadirs represent "best frequencies" of the cells. Also shown are tuning curves for neurons in the trapezoid body (B), inferior colliculus (C), medial geniculate nucleus (D), and auditory cortex (E). (Katsuki Y: Neural mechanisms of auditory sensation in cats. In Rosenblith WA [ed]: Sensory Communication. Cambridge MA, MIT Press, 1961) |
The lateral lemniscus contains both second and third-order neurons that project either directly or indirectly to the inferior colliculus, which is an obligatory relay for all auditory fibers. Cells of the inferior colliculus project to the medial geniculate nucleus bilaterally, and the medial geniculate nucleus projects to the primary auditory cerebral cortex, located on the superior and medial aspect of the temporal lobe, as indicated in Figure 8-15. The responses of neurons in the various nuclei of the central auditory system resemble those of primary auditory neurons in many ways, but they also differ in important ways. As shown in Figure 8-13, the cells of the trapezoid body (b), inferior colliculus (c), medial geniculate nucleus (d), and primary auditory cortex (e) respond to quite a wide range of sound frequencies and exhibit tuning curves reminiscent of those for auditory nerve fibers (Fig. 8-13a). Note that the curves are narrower (i.e., the range of frequencies that causes the cell to discharge is smaller) for higher order neurons (indicated by numbers in Fig. 8-14) up to the level of the medial geniculate nucleus, and then they get wider again. This narrowing represents a sharpening of the cells' frequency discrimination abilities and probably results from a process like lateral inhibition, where cells with close best frequencies inhibit each other. Some investigators have concluded on the basis of this observation that frequency and intensity discriminations are accomplished at or before the medial geniculate level, because cortical neurons simply do not have fine discriminative behavior (i.e., they have wide tuning curves). This is probably true, at least in animals.
 |
Fig. 8-14. Central auditory pathways. First, second, third, and fourth-order cells are indicated by the numerals. |
Neurons in the auditory nerve change their frequency of discharge with changes in sound intensity. Sample intensity functions for these and other cells of the auditory system are illustrated in Figure 8-16. The relationship between intensity and discharge frequency is sigmoid for auditory nerve fibers and cells of the trapezoid body and the superior olive. These cells increase their frequency of discharge with increasing sound intensity, slowly at first and then more rapidly, to a certain intensity, at which the frequency reaches a maximum. At even greater intensities, there is no further increase in frequency. Cells of the medial geniculate nucleus and the auditory cortex do not increase their frequency of discharge with increasing intensity of sound. (This is the reason for claiming that intensity discriminations occur below this level.) Neurons at successively higher levels of the auditory system discharge fewer spikes in response to a standard tone. Below the level of the inferior colliculus, neurons give repetitive responses to maintained tone stimuli, but at and above the level of the colliculus, they more often give on-, off-, or on-off responses (these terms are used here in the same manner as for visual cells, see Chapter 7). In the auditory cortex, there are seldom continuous responses to sustained tones; most cells signal sound onset or offset or both.
 |
Fig. 8-15. Diagram to indicate the location of the primary auditory cortex on the superior lip of the temporal lobe. (Guyton A: Textbook of Physiology. Philadelphia, WB Saunders, 1976) |
However, sounds that we hear are seldom pure tones (i.e., tones of a single frequency) as were those employed in the preceding experiments. More often, they are composites of sine waves of different frequencies and amplitudes. We know little about how the nervous system deals with such complex sounds, but a beginning has been made. In the cochlear and medial geniculate nuclei, the response to a tone is unaffected by a second tone (of different frequency) presented simultaneously at weak intensity. As the second tone is increased in intensity, the response to the first tone is gradually suppressed until it finally fails completely. At this intensity, only responses to the second tone are seen if its frequency lies within the response range of the neuron. In the cerebral cortex, the same maneuver performed on a cell with high best frequency results in enhancement of the cell's response if the tones are harmonically related (i.e., if the ratio of their frequencies is 1:2, 1:3, 1:4) or if the difference in frequency is such that it results in 50 to 200 beats/sec. The greater the frequency of beats, the larger the discharge up to 100 beats/sec. Above 100, the response falls off again. It is tempting to speculate that cortical neurons are playing some role in decoding complex sounds or tone patterns, somehow using beats and harmonics.
 |
Fig. 8-16. Intensity functions for neurons in the cochlear nerve, trapezoid body, superior olivary complx, auditory cortex, and medial geniculate nucleus of the cat. Frequency of discharge of the neurons is plotted on the ordinate against sound intensity on the abscissa. (Katsuki Y: Neural mechanism of auditory sensation in cats. In Rosenblith WA [ed]: Sensory Communication. Cambridge MA, MIT Press, 1961) |
The auditory system appears to be arranged topographically, much like the somatosensory system. It is possible to map the cochlea onto the various structures of the auditory system by mapping best frequencies. The auditory nerve has a predominance of fibers with high best frequencies on the outside of the bundle; fibers with low best frequencies lie in the center. The cochlear nucleus is arranged such that cells with high best frequencies are dorsal, and successively more ventral cells have lower best frequencies. This is often called a tonotopic representation (or a receptotopic or cochleotopic representation, if the particular author is a strong adherent to the place theory). Unlike the somatic system, the auditory system has a plethora of such representations at each level. Thus, there are three in the cochlear nucleus and two in the superior olivary complex, the inferior colliculus, and the medial geniculate nucleus. At the cortex, the sublime becomes ridiculous, with five tonotopic representations having been defined. These representations are either strict or loose depending upon whether anesthetized or unanesthetized preparations are used. In unanesthetized animals, a good many "ringers" (apparently inappropriately placed) appear in an otherwise orderly arrangement of neurons based upon best frequencies. As in the somatic system, we do not know if the spatial arrangement of neurons has some functional significance or if it is an "accident" of the developmental or some other kind of process.
Effects of cortical damage
Removal of all cortical areas dealing with audition bilaterally is a rare event in humans, but the surgery can be performed in experimental animals, although the testing of the auditory capacities is not an easy matter. Unilateral removal of the auditory cortex produces only slight changes in auditory threshold, but bilateral removal produces a significant elevation of auditory threshold (70-75 dB in dogs), profound deficits in frequency discrimination ability (perhaps related more to performance than sensation), inability to discriminate simple tone patterns, and severe deficits in ability to localize the source of a sound in space. |
Fig. 8-17. Diagram to illustrate the path taken by sound waves coming from sources located at various positions with respect to the head of the observer. |
Resolving power of the human auditory apparatus is greatest near the median plane (the midsagittal plane) where lateral changes in position of a sound source as small as 1° can be detected. At 90° from the median plane, a change in position by as much as 40° may be undetected. Within the median plane itself, sounds are not localizable unless the head is moved because a stationary source of sound produces the same signal in both ears.
Localization of sound sources also depends upon frequency, with best performance for sounds of 2-8 kHz, and on the nature of the sound. Clicks are much more easily localized than either tones or other continuous sounds. Sound localization appears to be linked to sensitivity to high-frequency sounds. The better the sensitivity, the greater the localizing ability.
Because sound localization depends upon comparison of signals from the two ears, a lesion of the auditory system at sites that receive convergence from both ears should produce impairment in this ability. Transection of the trapezoid body, lesion of the superior olive, lesion of the inferior colliculus, and transection of the lateral lemniscus all produce impairments of localization in animals just as severe as lesions of the auditory cerebral cortex.
Efferent control of cochlear sensitivity
In addition to the primary afferent connections to hair cells already described, there are efferent (with respect to the central nervous system) connections from fibers originating in both the contralateral and ipsilateral superior olives and running in the eighth nerve. These fibers terminate on the bases of the inner hair cells and on the primary afferent neurons near their points of contact with the outer hair cells (see Fig. 8-9). Together these 500 fibers form what has been called the olivocochlear bundle. They discharge in response to sound stimulation of either ear with thresholds of about 40 dB (SPL) and show typical auditory tuning curves. Each fiber appears to have a best frequency that corresponds with the best frequency of the afferent fibers arising from the same hair cells it innervates. Thus, axons going to the basal turns of the cochlea have high best frequencies, whereas those going to apical turns have low best frequencies. |
Fig. 8-18. Intensity function for primary auditory neurons with and without efferent stimulation. "Without stimulation" curve (blue) shows responses to 40-msec tones at the best frequency (16.5 kHz) at various intensities. "With stimulation" curve (pink) shows the responses to the same tones preceded by 10 msec by 32 shocks to the crossed olivocochlear bundle at 400/sec. The shift in the function due to efferent activity is 10 dB. (Wiederhold ML: J Acoust Soc Amer 48:966-977, 1970) |
The effect of stimulation of the olivocochlear bundle upon the intensity functions of auditory primary afferent neurons is illustrated in Figure 8-18. Responses are shown for 40-msec tones at the best frequency for the neuron, 16.5 kHz. Without stimulation of the bundle (blue curve), the auditory neuron shows a typical sigmoid intensity function. With stimulation of the bundle (pink curve), the same kind of response curve is generated, but it is shifted about 10 dB to the right, toward higher thresholds. The amount of this shift varies from 1-25 dB, and it is greatest for cells with best frequencies in the range of 6-10 kHz. Presumably this effect occurs because of stiffening of the tectorial membrane by actin-induced stiffening of the stereocilia. This is likely brought about by the activity in the olivocochlear bundle.
It has been suggested that the function of the olivocochlear bundle is to raise the threshold of auditory nerve fibers in order to make them insensitive to noise, yet still sensitive to moderate to loud sounds. With activity in the bundle, the organism can be insensitive to environmental noise, yet still be responsive to other important signals. This hypothesis receives some support from observations that responses of the auditory nerve to moderately intense clicks were almost completely masked by simultaneous low-intensity clicks delivered at high rates. Stimulation of the bundle unmasked the responses to the intense clicks by reducing the responses to the low intensity ones. In addition, discrimination by monkeys of vowel sounds presented against a background noise was impaired by sectioning the bundle.
| Alternate routes of conduction and hearing loss |
It is clear that the primary or dominant pathway by which vibratory energy reaches the cochlea is through the ossicular chain, but this is not the only route. Vibrations may be conducted through the air of the middle ear directly to the cochlea, mainly through the round window. In addition, the perilymph can be caused to vibrate by oscillations conducted through the bones of the skull and the bony labyrinth. Bone conduction is responsible for the different sound of your voice when you listen to it as you speak, which involves both bone and air conduction, and when you listen to a tape recording of it, which involves air conduction alone. It is bone conduction that lets you hear the loud crunch as you bite a piece of something hard. The existence of these alternate routes to the auditory receptors offers the clinician some simple tests of the origin of many hearing losses.
Audiologists usually distinguish two types of hearing loss: conduction hearing loss and nerve (or sensorineural) hearing loss. Conduction hearing loss can be the result of obstruction of the external meatus, some damage to the tympanic membrane, or some disease of the middle ear. The most common form of middle ear disease is an infection (otitis media), which, if prolonged, can lead to the formation of scars that reduce the mobility of the tympanic membrane or the ossicles. Otosclerosis is a condition in which there is abnormal growth of bone that may cement the stapes in the oval window or reduce its ability to move. Nerve hearing loss may result from some damage to the cochlea (cochlear-conductive), the hair cells (sensory), the auditory nerve (neural), the stria vascularis (metabolic) or some auditory structure of the central nervous system (retrocochlear).
These two forms of hearing loss can be distinguished using a simple tuning fork (preferably one of frequency 500 Hz, because it is easily heard above room noise). In Weber's test, the fork is struck and placed in the middle of the patient's forehead. If he has normal hearing or equal hearing loss on both sides, he will report that the sound comes from the middle of his head. If he has nerve hearing loss which is worse in one ear, he will report the tone to be heard better in the better ear. Alternatively, the tone will be heard better in the poorer ear if he has an asymmetric conduction hearing loss.
It is commonly said that Weber's test works because the signal of the tuning fork is masked in the good ear by room noise that cannot reach the ear with conduction hearing loss. This cannot be the case because the test works even in very quiet rooms or if the sound is not allowed to reach either ear by conduction through the air. The success of Weber's test is most reasonably explained in terms of the properties of the conduction system itself. Bone-conducted sound sets the fluids of the cochlea in motion, vibrating the basilar membrane and also vibrating the membrane of the oval window. The ossicles and tympanic membrane are set in motion by these vibrations at the oval window, shunting off some of the vibratory energy in the cochlea. If the ossicles cannot move, say because of otosclerosis, then this shunting is reduced and more of the energy is transmitted to the basilar membrane, increasing the apparent loudness of the sound. The same effect can be achieved in a normal individual. To demonstrate this, try the following maneuver. Say something out loud, and while you say it, stick your finger in your ear. The sound will become louder in that ear because you have prevented the tympanic membrane from pushing air out of the external meatus. The tympanic membrane cannot move as readily under these conditions so less energy is lost through the ossicular chain and the sound becomes louder.
 |
Fig. 8-19. A. Audiogram or hearing-loss curve for a patient with neural hearing loss. Circles indicate hearing losses for air conduction whereas squares indicate hearing loss for bone conduction. In neural hearing loss both curves tend to show similar losses. B. Audiogram of patient with pure conduction hearing loss. Note that bone conduction is unimpaired at all frequencies. (Mayer D, Schlosser WD, Winchester RA [eds]: Otologic Diagnosis and the Treatment of Deafness. Summit NJ, Ciba, 1970) |
So far, using Weber's test, only a comparison of the two ears has been made. However, following this procedure with Rinne's test will tell whether the deficit is in conduction or not. After being struck, the fork is placed on the mastoid process until its vibration can no longer be heard. Then the fork is held next to the auricle while it is still vibrating. It is normal to hear the vibration in air after none can be heard through bone conduction (with tuning fork on the mastoid), but if it is known that there is some impairment, this result indicates a mixture of both conduction and neural hearing loss. Conduction hearing loss alone is indicated by the inability to hear the sound by air conduction in Rinne's test.
If hearing loss of either origin is indicated, a quantitative indication of the hearing loss is obtained from an audiogram. Figure 8-19A shows the audiogram of a patient with neural hearing loss. The circles in the audiogram indicate the hearing loss as measured by air conduction, whereas the squares indicate the hearing loss as measured by bone conduction. Typically, in neural hearing loss, both measures show the same pattern of loss. Surgery is not indicated for this form of hearing loss because the neural tissue probably cannot be repaired, but some improvement in hearing is possible with a hearing aid, depending upon the nature of the damage. Figure 8-19B shows the audiogram of a person with pure conduction hearing loss. In this case, bone conduction is near normal, i.e., near 0 dB loss, but air conduction is impaired. Notice that the air audiogram is nearly flat with conduction hearing loss (Fig. 8-19B), but there is a differential loss, depending upon frequency, in nerve hearing loss (Fig. 8-19A). This is a typical result. Surgery may be helpful in many cases of conduction hearing loss, because removal of the obstruction to normal movement in the middle ear may be possible. In some cases, the stapes may be removed entirely and a prosthetic stapes put in its place. In some cases, a cochlear implant (a series of electrodes driven by an audio receiver and threaded into the cochlea) is useful in restoring auditory functioning provided that there are functioning neurons in the spiral ganglion.
| The effect of loud noise on the cochlea |
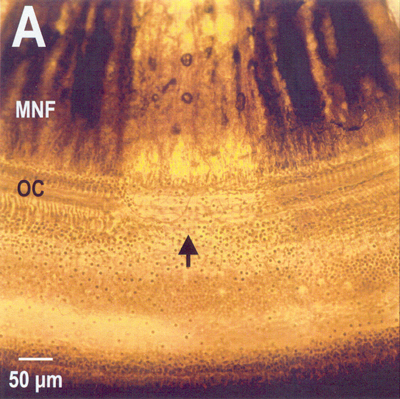 |
Fig. 8-20. Severe noise damage. Shown is a total loss of a region of the organ of Corti along with the nerve fibers that innervated it. MNF=myelinated nerve fibers; OC=organ of Corti. (Photo and editorial help courtesy of Barbara A. Bohne and Gary W. Harding, Department of Otolaryngology, Washington University School of Medicine, St. Louis, MO) |
Earlier, it was indicated that the intrinsic muscles of the middle ear cannot completely protect the delicate apparatus of the inner ear. Figure 8-20 shows a surface preparation under phase contrast of a section of the cochlea of a chinchilla subjected to loud noise. Note that the organ of Corti is missing in the region indicated by the arrow. Also note that the myelinated nerve fibers that innervated that section of the organ are missing. Milder damage occurs with exposure to less loud sounds. In this case, there is a scattered loss of outer hair cells with other outer hair cells and all inner hair cells unaffected. This sort of damage, which can be mimicked by the drug kanamycin, results in increases in the displacement threshold of auditory nerve fibers and broadening of their tuning curves. Obviously, this kind of damage is not repairable. It is interesting that in cases of high frequency overstimulation the damage is found near the base of the cochlea, whereas when lower frequencies are used, the damage is found closer to the apex.
| Summary |
The ear is an organ specialized to receive and respond to vibrations in air, that is, sound. Anatomically, the ear consists of three parts: the outer, middle, and inner ears. The outer ear serves mainly as a collector of sounds, but also serves to protect the delicate tympanic membrane and gives some amplification of sound intensity. The middle ear transmits the sound from the air to the receptors in the fluid of the cochlea and alters the low pressure, high displacement air waves to high pressure, low displacement waves, appropriate for transmission in the fluid. The middle ear also contains muscles that protect the inner ear (to some extent) from overstimulation. Movement of the membrane of the oval window results in displacement of the cochlear fluid that, in turn, results in movement of the basilar membrane. The stereocilia of the receptor or hair cells are subjected to shearing forces by the unequal movements of the basilar and tectorial membranes. These forces lead to generator potentials in the hair cells; the generator potentials cause release of transmitter substance onto the connected neurons and generation of action potentials in the primary afferent fibers. Pitch is probably encoded both by frequency of discharge in auditory nerve fibers (frequency theory) and by which fibers are active (place theory). The existence of traveling waves on the basilar membrane leads auditory nerve fibers to give responses to a wide range of frequencies, but there is always one frequency to which each is most sensitive, the best frequency. Auditory neurons in the central nervous system also have tuned responses, and they are ordered (to some extent) in tonotopic arrays. Pitch and intensity discrimination are probably mainly subcortical functions, whereas the cortex appears to be involved in discrimination of tone patterns, localization of sound in space, and lowering auditory discrimination limens. The sensitivity of the receptors themselves is under control by the olivocochlear bundle. This control probably acts in situations where background noises may mask important sounds. The existence of a second conduction pathway to the cochlea through bone gives the clinician two useful tests of auditory function: Weber's test and Rinne's test. Very loud sounds that are prolonged or repeated can lead to damage or destruction on the basilar membrane at sites appropriate for the frequency of the sounds.
| Suggested Reading: |
- Bohne BA, Harding GW: Degeneration in the cochlea after noise damage: Primary versus secondary events. Amer J Otology 21:505-509, 2000.
- Dallos P: The Auditory Periphery: Biophysics and Physiology. New York, Academic Press, 1973.
- Dallos P, Popper A, Fay R (ed.): The Cochlea. 1996.
- Durrant J, Lovrinic J: Bases of Hearing Science. 3rd Edition, 1995.
- Engstrom H, Ades HW, Hawkins JE II: Structure and functions of the sensory hairs of the inner ear. J Acoust Soc Amer 34:1356-1363, 1962.
- Hudspeth AJ: Hearing. In Kandel ER, Schwartz JH, Jessell TM (ed.): Principles of Neural Science. 4th Edition. New York: McGraw-Hill, 2000, pp. 590-613.
- Hudspeth AJ: Sensory transduction in the ear. In Kandel ER, Schwartz JH, Jessell TM (ed.): Principles of Neural Science. 4th Edition. New York: McGraw-Hill, 2000, pp. 614-624.
- Kiang NY-S, Watanabe T, Thomas EC, Clark LF: Discharge Patterns in the Cat's Auditory Nerve. Cambridge, MA, MIT Press, 1965.
- Møller AR [ed]: Basic Mechanisms in Hearing. New York, Academic Press, 1973.
- Nomoto M, Suga N, Katsuki Y: Discharge pattern and inhibition of primary auditory nerve fibers in the monkey. J Neurophysiol 27:768-787, 1964.
- Sachs MB: Stimulus-response relation for auditory nerve fibers: two-tone stimuli. J Acoust Soc Amer 45:1025-1036, 1969.
- Sataloff J, Sataloff RT, Vassallo LA: Hearing Loss, 2nd ed. Philadelphia, Lippincott, 1980.
- Schuknecht H: Pathology of the Ear. 3rd Edition, 1993.
- Spoendlin H: The Organization of the Cochlear Receptor. Basel, S. Karger, 1966.
- Spoendlin H: Primary neurons and synapses. In Friedmann I, Balantyne J (ed.): Ultrastructural Atlas of the Inner Ear. London, Butterworths, pp. 133-164, 1984.
- Webster WR, Atkin LM: Central auditory processing. In Gazzaniga MS, Blakemore C [ed]: Handbook of Psychobiology. New York, Academic Press, 1975.
- Wever EG, Lawrence M: Sound conduction in the cochlea. Ann Otol Rhinol Laryngol 61: 824-835, 1952.
- Wiederhold ML: Variation in the effects of electric stimulation of the crossed olivocochlear bundle on cat single auditory-nerve fiber responses to tone bursts. J Acoust Soc Amer 48:966-977, 1970.
- von Bekesy G: Experiments in Hearing. Huntington, NY, Kreiger, 1978.
Footnotes:
1. Only the upper half of the envelopes of the traveling waves are shown.
2. Second, third and fourth-order neurons are indicated by the numerals.
3. Other animals, especially those with small heads, do their localization using different parameters. If the head is small, then the differences in time of arrival and phase at arrival may be too small to be detected by the nervous system.
[TOC] [Chapter 9] [Glossary] [Index] [Abbreviations]